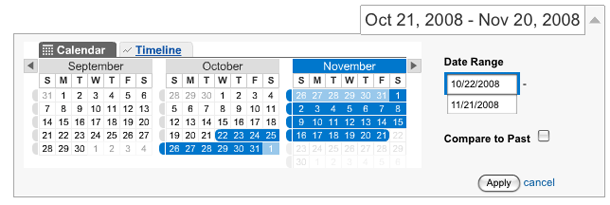
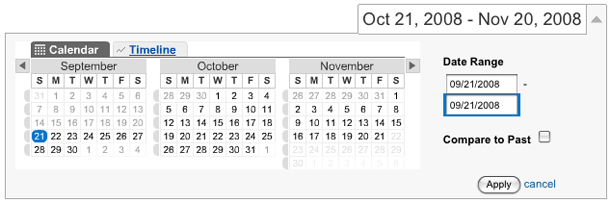
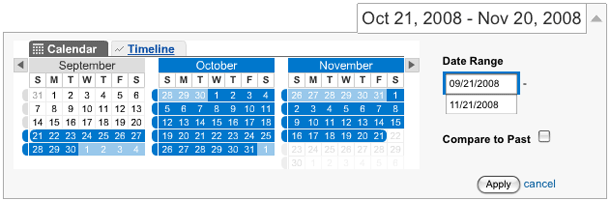
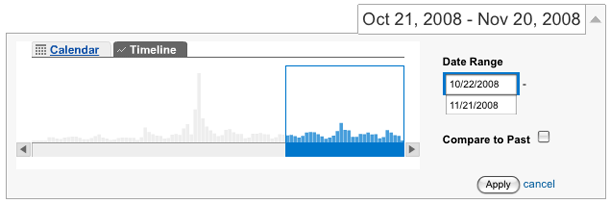
Google Analytics offers one of the most sophisticated date selectors for data filtering that I've seen. The interface allows you to filter reports to a single day by clicking one square in a 3 month range. To select a date range, you click the start input, click a day, and do the same for the end date range. Or you can enter dates in the text inputs.
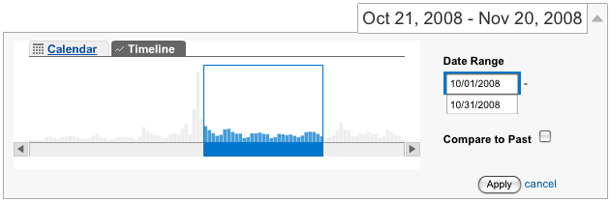
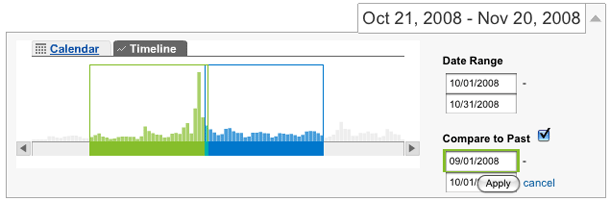
The timeline control allows you to visualize the volume of visitor activity as vertical bars, and adjust the date range by pulling slider handles. They don't include tick marks for date milestones, e.g. month/week ticks would be useful, so you have to watch the dates change in the inputs as you drag. The "Compare to past" functionality works well here too, because you really need to compare ranges of equal length. Clicking compare to past opens up a second range in green, and you can drag the ranges back and forth in time.
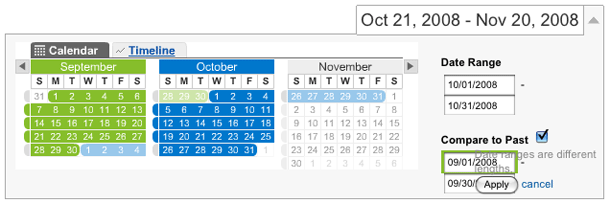
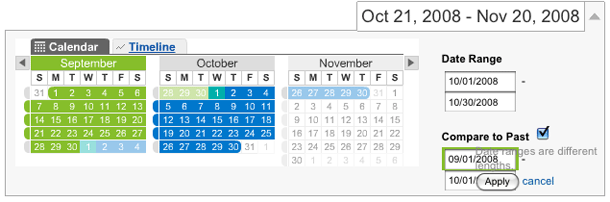
Comparing to past is a little less intuitive in the calendar view if you rely on clicking to make your selections. I just found it hard to click the input first before clicking the calendar to indicate whether I'm enter a start or end date. The best bet is to use the input controls there because it's easy to mistakenly create ranges of different length and overlap ranges. They do provide visual cues when there's an overlap by showing those dates as mixed green/blue squares.