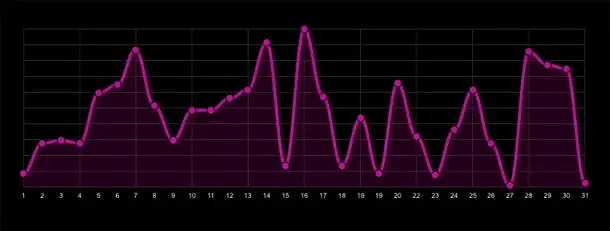
Henrik pointed me to Raphaël, a nice JS library for generating interactive charts.
Raphaël is a small JavaScript library that should simplify your work with vector graphics on the web. In case you want to create your own specific chart or image crop-n-rotate widget, you can simply achieve it with this library.
Raphaël uses SVG and VML as a base for graphics creation. Because of that every created object is a DOM object so you can attach JavaScript event handlers or modify objects later. Raphaël’s goal is to provide an adapter that will make drawing cross-browser and easy.
Via tweet from Henrik Lied
